Versions
- 6.12.28: Fixed issue with length of month. The length of a month is now set to 30 days and 10 hours. As a result, the duration “1 month 1 hour” actually means 30 days and 11 hours.
- 6.12.27: Fixed issues with selecting all options in the list. Lazy computation of first and last date. Fixed issue with directly-follows filters.
- 6.12.25: Using a much faster way to select all items in a list.
- 6.12.23: Do not show graphs with more than 10,000 different values (to prevent them from taking too long).
- 6.12.22: First/last projection filters now project on selected values, that is, not necessarily the same selected values.
- 6.12.20: Removed gradient from bar charts, centralized look&feel of charts.
- 6.12.19: Prevented integer overflows while computing durations.
- 6.12.18: Removed background colors from charts.
- 6.12.17: Added precision to “Select traces on duration” filter.
- 6.12.15: Added “Select traces on duration” filter.
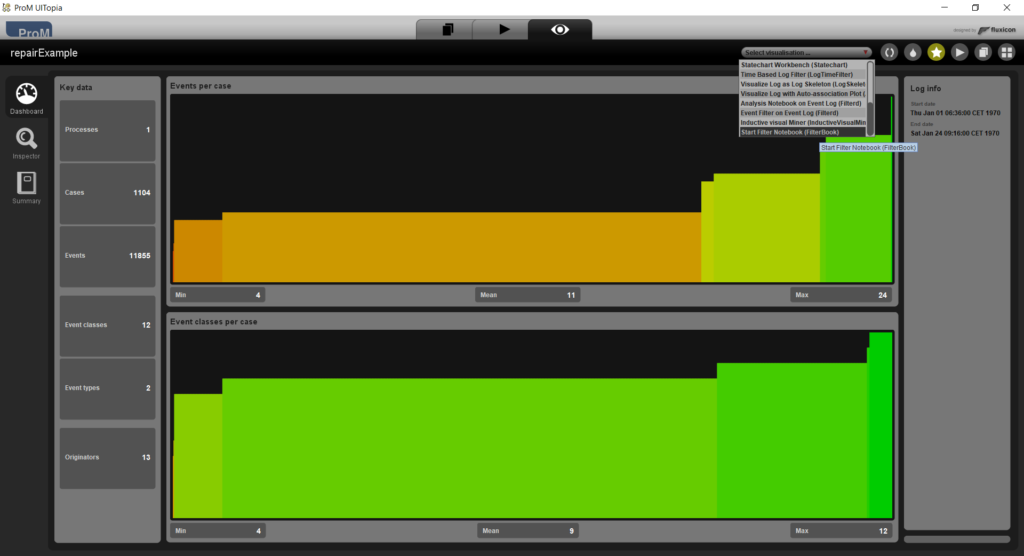
How to start a Filter Notebook?
Select an event log (we use an example event log here), open a visualizer, and then select the “Start Filter Notebook” visualizer:
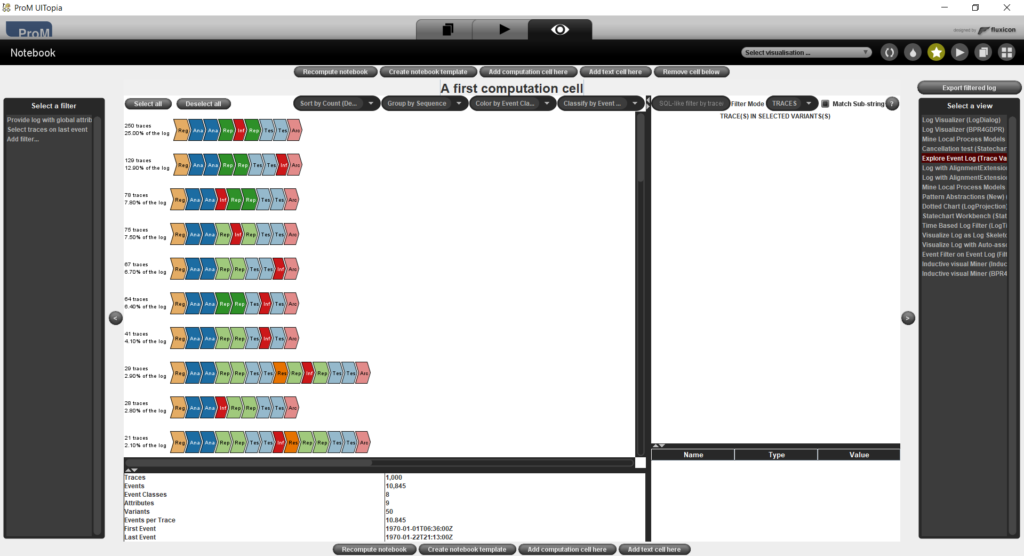
What do I see in a Filter Notebook?
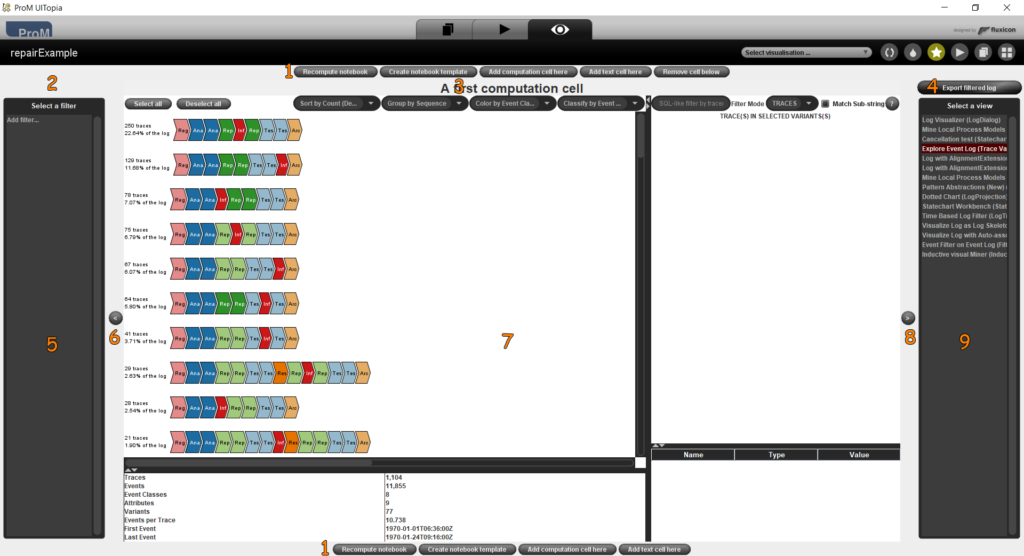
- A button bar that may contain the following buttons:
- Recompute notebook: Recompute the entire notebook by recomputing all computation cells from top to bottom
- Create notebook template: Create a notebook template for the notebook and exports this template into the workspace. This template can be exported and imported.
- Add computation cell here: Add a computation cell at this position.
- Add text cell here: Add a text cell at this position.
- Swap cells: Swap the cell above with the cell below. If the cell below uses the output log of the cell above as input log, it will be set to the input log of the computation cell.
- Remove cell below: Remove the cell below. If any of the following cells use the output log of this cell as input log, they will be set to the input log of the computation cell.
- If the computation cell needs to be recomputed and can be recomputed, a button will appear here to do so. A computation cell cannot be recomputed if its input log is not yet available.
- The name of the computation cell. Click the name to start editing it.
- A button to export the output log of the computation cell into the workspace.
- The current stack of filters. The last option in this stack is always the option to add a filter to the stack. If there are any preceding computation cells, the top part of this area is used to allow the user to select an input log from the output logs of these preceding computation cells and the input log of the computation cell.
- A button to show or hide the filter stack. By default, the filter stack is shown.
- The visualization of the output log of the computation cell.
- A button to show or hide the visualizers list. By default, the visualizers list is shown.
- The list of possible visualizers. By default, the “Explore Event Log” visualizer is selected.
How can I add a filter?
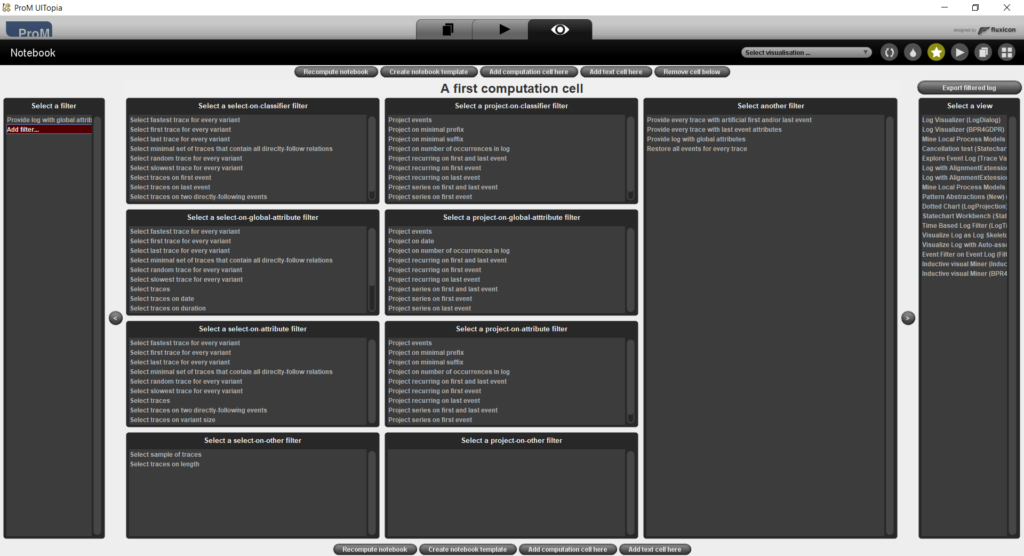
Select the “Add filter…” item in the filter stack. This replaces the visualization of the output log with the overview of available filters:
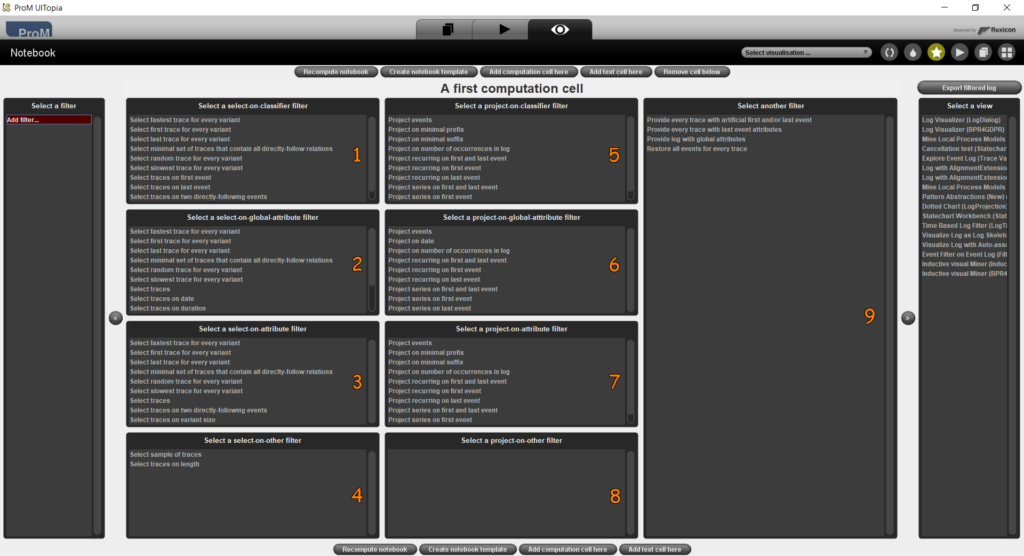
- Filters that select traces using a classifier.
- Filters that select traces using a global attribute.
- Filters that select traces using an attribute.
- Filters that select traces in other ways.
- Filters that project traces using a classifier.
- Filters that project traces using a global attribute.
- Filters that project traces using an attribute.
- Filters that project traces in other ways.
- Other filters.
This overview only shows the filters that can accept the input log. For example, if there are no timestamps in the event log, then the “Select on date” filters will not show. The reason these filters are not shown for this particular event log lies in the fact that the timestamp is not declared as a global attribute in this log. We will fix this first using the “Provide log with global attributes” filter.
Select “Provide log with global attributes”. This replaces the overview of filters with the configuration panel for this particular filter:
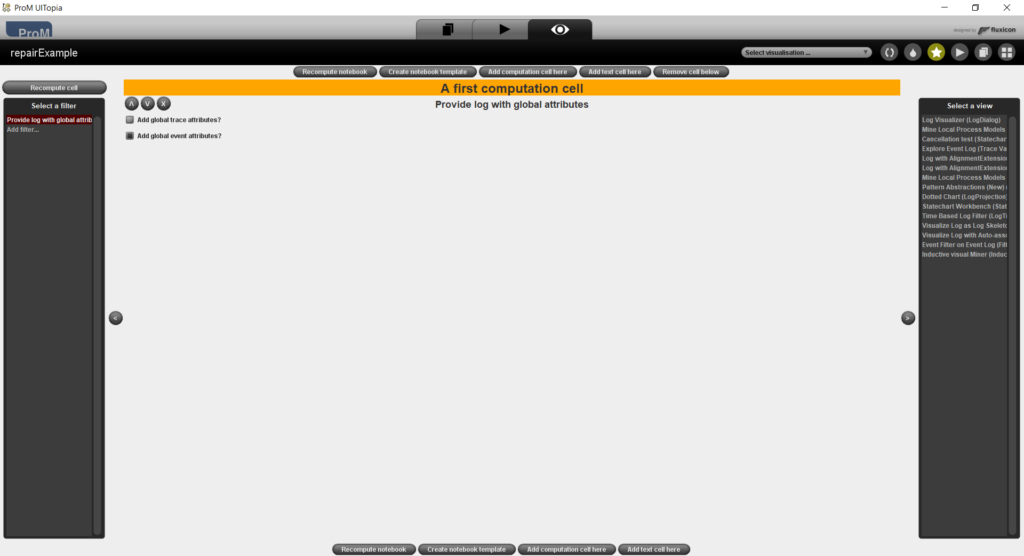
Select the option to add global event attributes (as shown in the figure), select the “Recompute cell” button in the top left corner, and then select the “Add filter…” item in the filter stack again:
The “Select on date” filter has now become available, as has the “Project on date” filter.
Now select the “Select traces on last event” filter:
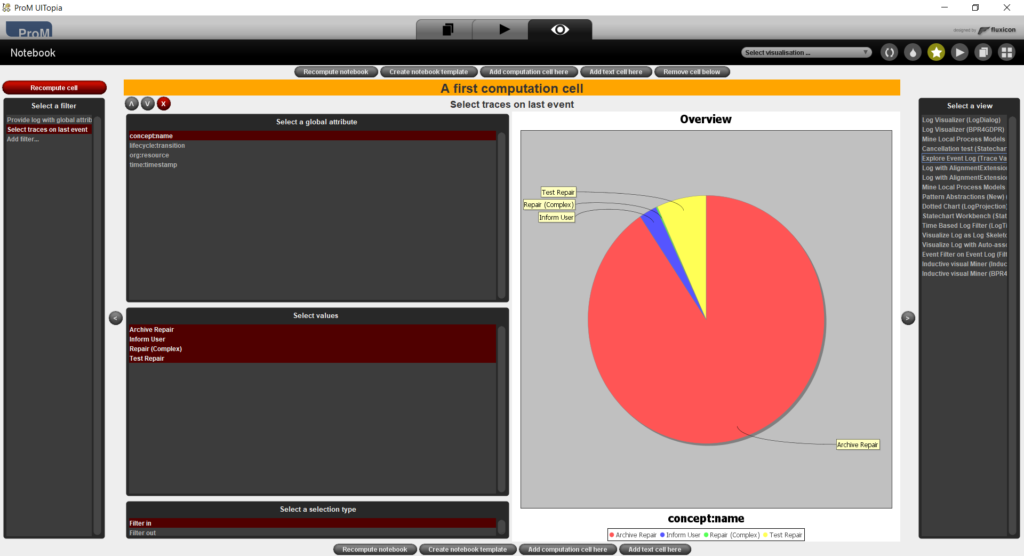
At the top left, three buttons are shown that can be used to move the filter up or down in the stack, or to remove the filter from the stack. To the right of these buttons, the name of the filter is shown. Below, the filter can be configured. For this particular filter, we can select:
- the global attribute to use (left hand side),
- the selected values for the global attribute (right hand side), and
- whether the selected values are filtered in (leaving only those traces that start with a selected value) or filtered out (leaving only those traces that do not start with a selected value).
At the right, statistic information is shown on the selected global attribute of the last even tin every trace. This shows clearly that the majority of traces end with an event that has the value “Archive Repair” for the “concept:name” attribute.
Also note that the “Recompute cell” button has now appeared, and that the background color of the cell name has changed to yellow. This indicates that the output log of the computation cell needs to be recomputed, and that it can be recomputed. If it cannot be recomputed, the button will not show and the background color will be blue.
Select only the “Archive Repair” value and select the “Recompute cell” button to recompute the output log. This replaces the filter configuration panel with the visualization of the new output log: